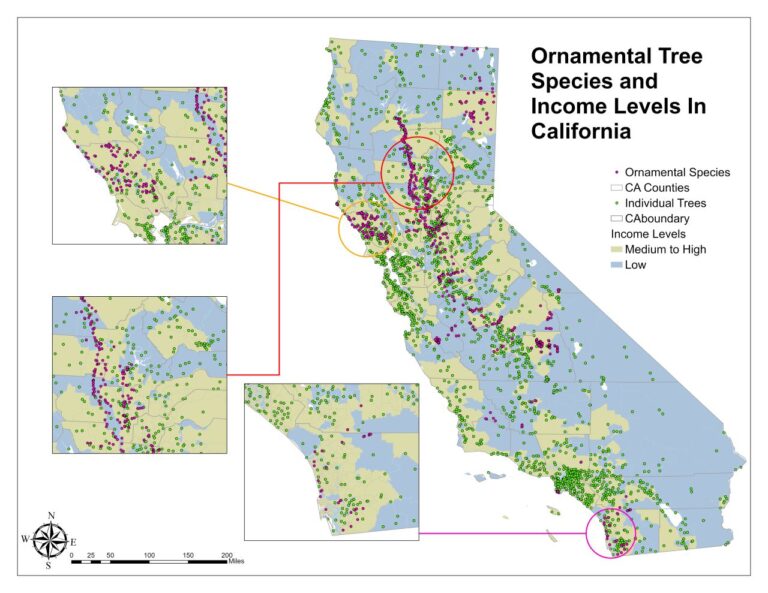
The map shows ornamental and general tree species in CA counties along with the income levels.
Income levels v.s. Tree Species in CA
In a revealing study, I applied advanced geospatial analysis techniques to investigate the intersection of socioeconomic status and tree species distribution across California. Utilizing a robust toolkit in ArcGIS Pro, including tools such as dissolve, spatial joins, overlays, and attribute selection, I conducted a comprehensive examination of how tree distribution varies with income levels across different counties.
My findings highlighted a pronounced disparity in tree coverage correlating with economic factors, revealing that wealthier areas tend to have a richer variety and higher density of tree species compared to lower-income regions. This research not only sheds light on environmental inequality but also underscores the broader implications of urban planning and socioeconomic factors on ecological diversity.
